The case for geothermal in six figures
Every number here is computed from the panels below and restates one of them. Daggers mark figures resting on Causeway judgement rather than a published source.
1. How the island of Ireland heated and cooled itself in the last week†
Showing all island.
How this is estimated, and why it is not metered
Annual buildings-heat anchors – SEAI Energy in Ireland 2025 and National Energy Balance (ROI); DfE Energy in Northern Ireland and NISRA Continuous Household Survey (NI) – are shaped by each week's population-weighted heating degree days (ERA5 via Open-Meteo). Gas gets a live regression where daily data exists; oil, the island's majority fuel, has no daily data anywhere – it is carried as an anchor plus a live price. Figures marked † are current Causeway Energies estimates – challenge and input welcome at contact@causewaygt.com.
The gas engine room
Daily non-daily-metered gas demand (ROI – homes and SMEs, power stations excluded) against population-weighted heating degree days. The temperature-sensitive slope is space heat. Calibration series via data.gov.ie (CC BY 4.0), quarterly refresh – the live GNI feed lands next. The slope is estimated by within-class (monthly) centring, removing seasonal confounds such as holidays and baseload drift; the variance statistic is within-month variance explained, and the residual standard error alongside the slope is the day-level uncertainty.
Heat-pump calibration
The Carnot fraction is solved, not assumed: for each route it is the value that makes the annual heat-weighted mean of the daily COP reproduce that route's published seasonal performance factor. The fraction describes machine quality, which should not differ by route – what differs is the source, and the Carnot term already carries it. So the three agreeing is the check rather than a coincidence, and the build says so in its log when they drift more than 15% apart.
Feed status
| Feed | Source | Status | Latest | Licence / terms | Flags |
|---|
2. What the island of Ireland's heat costs and emits
How this is estimated, and why it is not metered
What heat emits
Every route's carbon per useful kWh, live grid intensity
3. Electricity grid impacts — the 20% what-if, hour by hour
One fifth of the island of Ireland's heat, replaced three ways — air-source heat pumps, ground source, and geothermal networks — hour by hour. Where the heat comes from decides how much electricity the island has to find on its coldest hour.
The toggle switches WHOSE HEAT is electrified. It does not switch the ceiling: the SEM is a single all-island market with one dispatch, Northern Irish demand is met from all-island generation across the tie-lines, and a separate northern capacity ceiling would invent a constraint that does not exist. So each jurisdiction's what-if is measured against one shared block.†
Two axes. The filled band is total building heat delivered, read against the LEFT axis in GWh. The heat-pump lines are the electricity that would draw, read against the RIGHT axis - a different quantity in different units, which is the point: the heat is large and the electricity to deliver it is small, and how small depends on the route.
Wind that was thrown away — and why, month by month since 2021
What that energy was worth — at the prices of the hours it was actually spilled
What it would take to use it — two worked examples, sizing the load rather than claiming the saving
How the grid layer is built, and what it does not claim
4. The rising demand for cooling, and geothermal’s role
Ireland barely cools its buildings. It cools its machines a great deal — and that is the part that is growing.
What Ireland actually cools — dominated by process cooling
And the heat it rejects — banked in summer, recovered in winter
How these figures are built, and the one judgement in them
5. Irish geothermal: now, next and benchmarks
ROI has started, NI’s deployment to date is negligible. And neither has set a target.
Nobody has set a target — what the fifth can be measured against instead
The empty bar — installed hardware against the 20% what-if
The same fleets, calibrated — share of each country’s own buildings heat
What the bars price, and where the comparators come from
6. Value for money — geothermal against an air-source-led network
Not whether to build networks. Ireland has committed to that. Only what sits at the head of them.
Two stages — electrify first, then compare heat sources
What the subsurface earns — and what it costs, against an air-source network
What the grid operators currently assume — a flat heat-pump COP, out to 2050
How this is built, and what is still missing
The streams, one by one. The same five the bar above is made of, with what each is and how long it runs.
What would need to change — our view
This section is advocacy and is labelled as such: Causeway Energies develops geothermal projects in both jurisdictions. The interest declaration in the fold above applies.
Footnotes
Why heat?
Of everything the island pays for as energy – power, transport, heat – heat rivals transport as the largest service, carries the smallest bill per unit delivered – and is therefore still fossil.
Where these figures come from
The oil ticker
Per-litre basis so the border gap is price, not basket size – NI from the 900 L survey, ROI from the 1 000 L bulletin, and the two axes locked through the day's ECB rate so vertical position compares directly. Homes on both sides of the border burn the same C2 kerosene; the ROI series arrives under the EU bulletin's "heating gas oil" heading and is treated as an indicator of the ROI heating-oil price level† pending the official kerosene series. Dashed lines strip the tax – ROI from the bulletin's without-taxes series, NI by removing the 5% VAT, kerosene's only NI tax – so the distance between solid and dashed is the tax wedge, live. The grey line is Great Britain, daily – the same tax regime as NI, so the NI–GB gap is pure market structure: half a million oil-heated homes in a compact geography make NI's the densest, most competitive kerosene market in Europe. Vertical markers are policy events. Same fuel, two price regimes, one island.
Geothermal archetypes
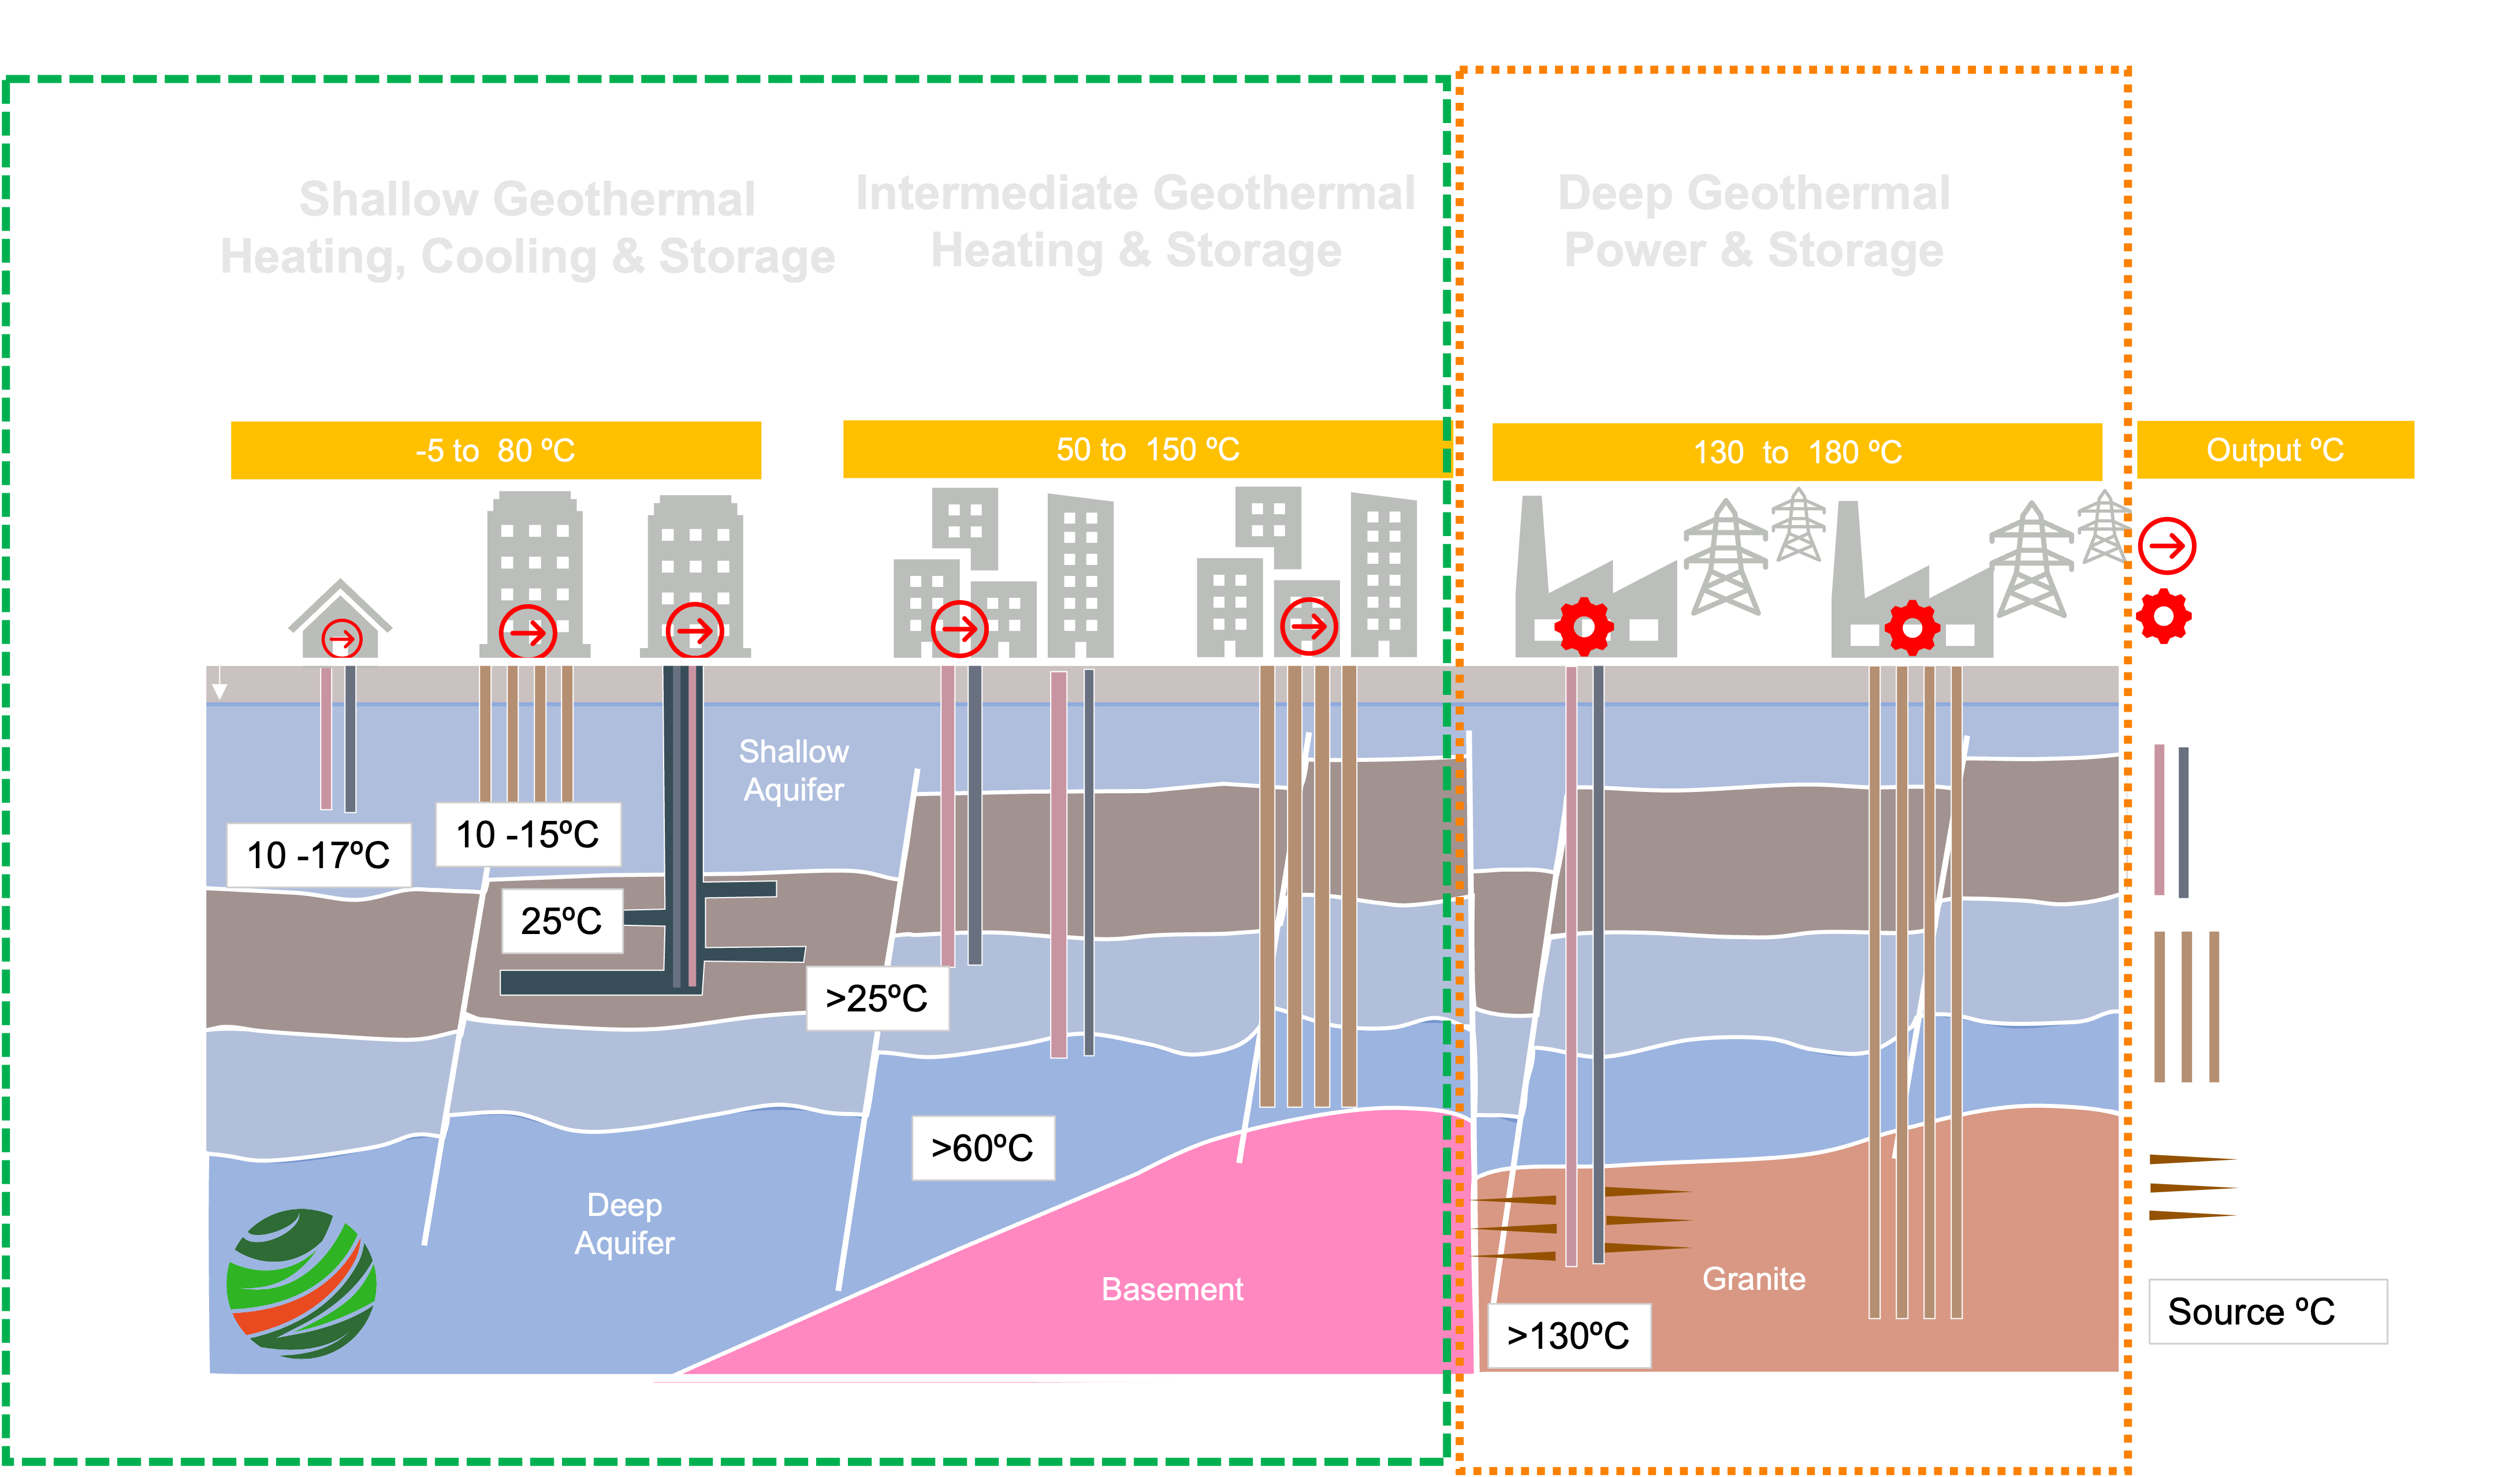
Geothermal is not one technology. What this site prices is the green box: heat and cooling from the shallow subsurface, and heat from the intermediate aquifers, both delivered through a heat pump and both able to STORE as well as supply. Power generation needs temperatures the island does not have at drillable depth, which is why it appears here only to be set aside.